

- Locations
- United States
- US Blogs
- Payer Controls: Goodbye, Old Assumptions for Access and Uptake
The entire healthcare industry is being squeezed. Patients who are already struggling to afford rising copays and deductibles now face new controls like Accumulator Adjuster Programs. Prescribers are being given less and less choice on patient treatment - even in areas like oncology. Payers are looking at new rare and orphan disease products coming into the market and asking how they are going to afford covering these innovative, but high cost, treatments.
In a previous blog, I described how pricing pressures, supply and demand factors, and policy uncertainty make it difficult to forecast and achieve net sales goals. It’s a phenomenon we at IQVIA call the “Big Squeeze.”
In this post, we will take a closer look at one factor tightening the squeeze: payer controls. As payers increase the quantity and complexity of controls, brands, particularly at launch, are more challenged than ever to convert demand into volume. Quite simply, payer coverage is more costly and difficult to attain than ever before.
Consider if you were launching a new brand in 2013: about half the time (54 percent), commercially insured patients successfully navigated controls to get on your product in its first year on market. By 2019, the proportion able to get on therapy in those first 12 months had fallen to just 34 percent. To put it another way, two out of three patients who wanted to start a new HCP-prescribed treatment were unable to.
Behind these trends is the growth in utilization and effectiveness of payer controls. In fact, IQVIA analysis has found that payer use of restrictions (prior authorization, step edits, pharmacy network restrictions, and National Drug Code (NDC) exclusions) for new launch brands rose by 68 percent from 2013 to 2019 — a trend that shows no sign of abating.
While payer controls exist across all therapeutic classes, they are often highest in specialty medicine. Brands that treat HIV, immunology, immunosuppressants, oral oncology, multiple sclerosis, and viral hepatitis have all experienced declines in demand efficiency as payer control has grown. Compared to 2013, patients in 2019 and 2020 across these classes were 20 percent less likely to fill their prescriptions in the first year following launch!
Complicating these issues is the fact that the largest payers, which now oversee upwards of 75% of the market, are also the most controlling. These industry giants have established controls for three-quarters of prescriptions in the previously mentioned specialty classes. From a contracting perspective, that’s impacting demand and driving up the cost of access.
For example, of these specialty patients who face a step edit, 60 percent simply can’t overcome it. In other words, six out of 10 patients do not make it onto the prescribed therapy. The numbers are even worse when facing an NDC block (also known as formulary exclusion). Eight out of 10 patients with an NDC block are unable to overcome it to get onto the prescribed therapy. Payers employ NDC blocks, step edits, and other controls because they work to lower utilization — and that’s unlikely to change in the near term.
How common are these types of controls? As of 2021, the largest pharmacy benefit managers (PBMs) are each blocking about 450 products. Compounded year-over-year annual growth for NDC exclusions has been greater than 50 percent, with more and more brands facing blocks every year.
What can you do about it? As you size your market and build your forecast, don’t fall back on old assumptions. New market dynamics require a more sophisticated data-driven approach. Leverage longitudinal data and analytics to account for payer controls and their impacts on both demand efficiency (patients’ ability to start on prescribed therapy) and cost of access (the resources you must invest to get your new product on formulary).
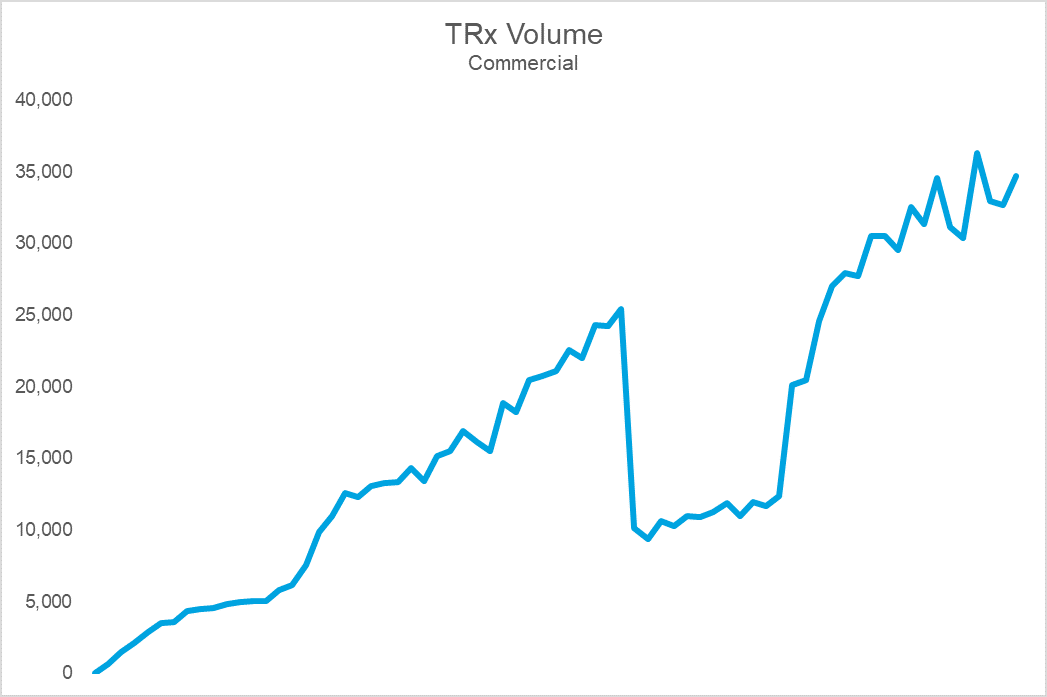
Here’s a quick case in point.


The top chart shows Brand X’s sales volume, while the bottom shows durable rejection rates (the percent of patients who remain rejected at 30 days). Notice that the cliff in volume coincides with a dramatic spike in rejections. The cause: an NDC block that led to an immediate and precipitous decline in volume upon implementation. For this brand, the impact on sales, utilization, and prescriber adoption was so challenging that they eventually gave steep rebates to get back onto formulary at this PBM. Following the return to formulary coverage, while the brand utilization rebounded, it was never able to fully regain the volume, or trajectory, it once had.
The growth in utilization of exclusions is forcing manufacturers to more aggressively contract. Payers have increasingly made coverage binary with NDC blocks– a brand is either on formulary or it is off. While a brand may be able to survive an exclusion on one of the large PBMs, being blocked by more than one can crater demand efficiency. Unfortunately, many brands, launch and otherwise, find themselves in these circumstances. Trying to build demand when you are only realizing 1 out of every 3 prescriptions is challenging to say the least.
Market access nuances like these become important to understand and monitor when forecasting or building payer, launch, marketing campaigns, and pull through strategies. Knowing where the easiest, and quickest, path to success lies means understanding many different dimensions of market access. Payer restrictions are just one of the barriers to adoption.
My next post will focus on the impact of cost sharing on patient behavior across payer channels. The rule is simple “The more a patient is asked to pay, the less likely they are to do so.” Until we meet again – good luck and stay safe!


