


- Blogs
- Identifying Key Opinion Leaders (KOLs) using Graph Analytics
At IQVIA, we are frequently asked by clients to help identify Key Opinion Leaders for a given therapeutic area and market. Traditionally, this work has been done using peer-nomination surveys. This is a respectable methodology with a long history but is open to various degrees of bias and can be expensive and time consuming due to the manual effort involved in the process.
I lead our Graph Analytics team in our larger AI/ML group, which applies network and topological techniques to various problems within the life sciences and healthcare domains. We model data using mathematical graphs or networks and use analytical techniques over these models. Modelling influence relationships between health care professionals (HCPs) is a natural application of these techniques, which have been used widely in social network analysis.

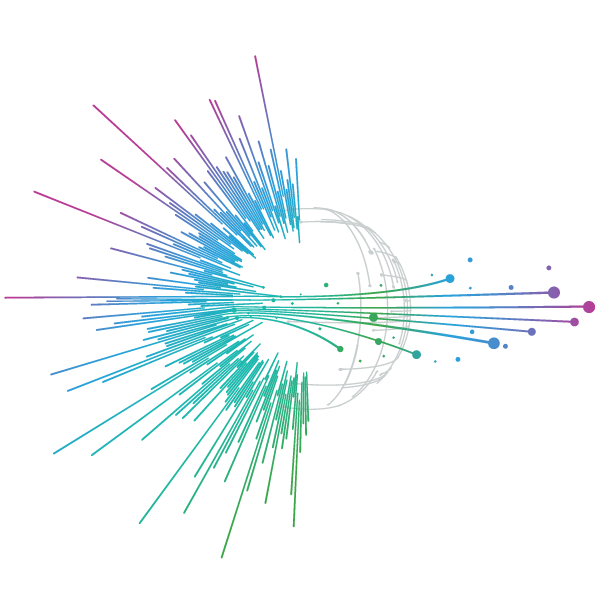
A simple first pass approach is to ingest data from various sources to build a multigraph showing all the different kinds of connections between HCPs (e.g. which HCPs have co-authored papers together, which HCPs have a patient-referring relationships, and many more). We can also weight these relationships based on the number or importance of the papers or the prescribing volumes depending on the dimensions we’re interested in. We can even combine this with conventional peer nomination data to get a richer picture if needed.

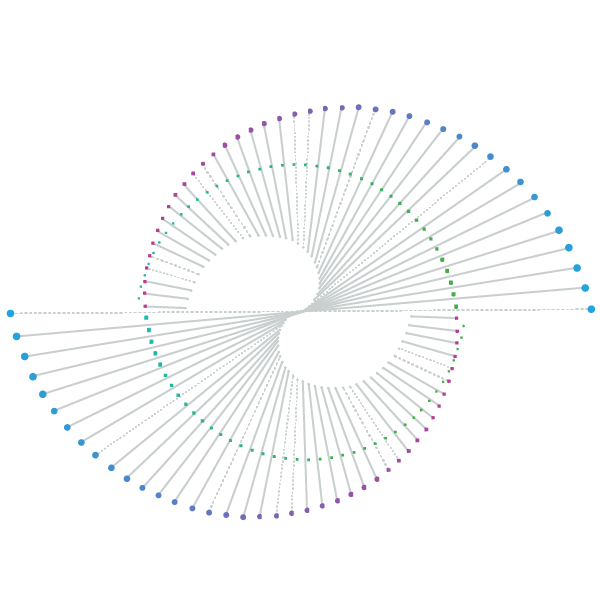
Once we have this network, it’s relatively straightforward to use graph centrality measures to determine who appears to have the most influence in the graph, and we can tailor this to the particular needs of a given project (e.g. are we looking for scientific influencers vs prescribing influencers). However, this on its own may not give us much beyond what could be done with conventional analysis of the various data sources.
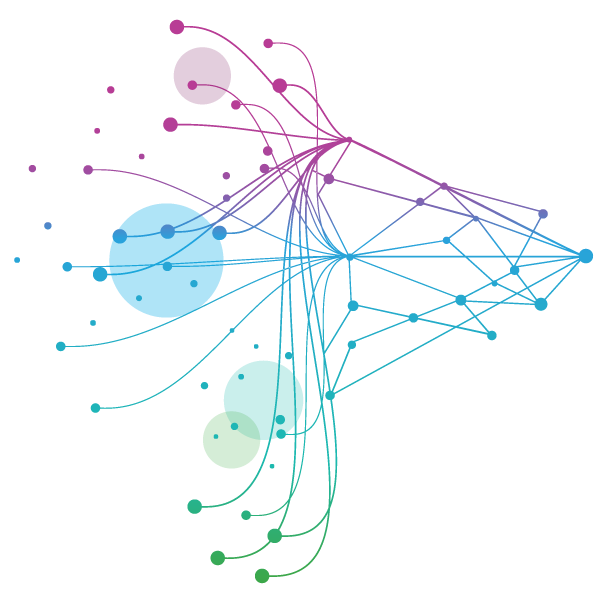
A more advanced step is to then consider how influence or messages propagate over the HCP networks. Once we seed a single HCP with a message, what is the probability that other HCPs in the network will receive the message (e.g. about the advantages of a new product)? Do we see cliques or clusters forming? These could be e.g. geographical or related to institutional affiliation, or more intriguingly not have obvious explainable meaning but still have predictive power.

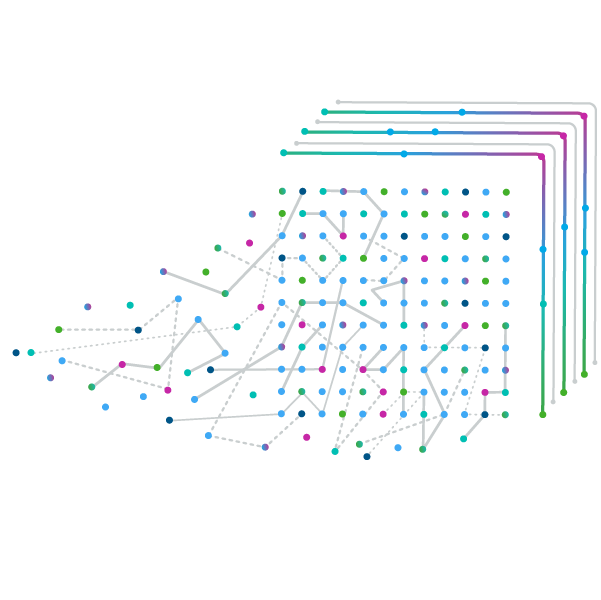
We can also run simulations over the network to determine which are the most effective HCPs to target given the network topology. This is a more nuanced approach than simply picking e.g. the top 20 highest ranked KOLs, because there’s a risk that if those top 20 KOLs are in similar influence cliques, then your limited resources may be better spent targeting HCPs lower in the overall scoring list, but more likely to have greater impact by reaching parts of the network you may not otherwise be able to reach.
As ever, we have to deal with incomplete data, and again there are graph analytical techniques such as link prediction algorithms that we can use to impute relationships that aren’t concretely available in the data (with some associated probability).
Finally, the big question after all this is to understand can we actually measure the impact of our messaging to KOLs? This can be tested using the same infrastructure used for peer nominations, by surveying samples of HCPs before and after messaging to see if messaging has diffused as expected. This can then be fed back in to the models to improve future iterations.
Interested in finding out how Graph Analytics can help you identify KOLs?