-
Americas

-
Asia & Oceania

-
A-I
J-Z

EMEA Thought Leadership
Developing IQVIA’s positions on key trends in the pharma and life sciences industries, with a focus on EMEA.
Learn more -
Middle East & Africa

EMEA Thought Leadership
Developing IQVIA’s positions on key trends in the pharma and life sciences industries, with a focus on EMEA.
Learn more
Regions
-
Americas
-
Asia & Oceania
-
Europe
-
Middle East & Africa
-
Americas
-
Asia & Oceania
-

Europe
Europe
- Adriatic
- Belgium
- Bulgaria
- Czech Republic
- Deutschland
- España
- France
- Greece
- Hungary
- Ireland
- Israel
- Italia
EMEA Thought Leadership
Developing IQVIA’s positions on key trends in the pharma and life sciences industries, with a focus on EMEA.
Learn more -
Middle East & Africa
EMEA Thought Leadership
Developing IQVIA’s positions on key trends in the pharma and life sciences industries, with a focus on EMEA.
Learn more
SOLUTIONS
-
Research & Development
-
Real World Evidence
-
Commercialization
-
Safety & Regulatory Compliance
-
Technologies
LIFE SCIENCE SEGMENTS
HEALTHCARE SEGMENTS
- Information Partner Services
- Financial Institutions
- Global Health
- Government
- Patient Associations
- Payers
- Providers
THERAPEUTIC AREAS
- Cardiovascular
- Cell and Gene Therapy
- Central Nervous System
- GI & Hepatology
- Infectious Diseases and Vaccines
- Oncology
- Pediatrics
- Rare Diseases
- View All

Impacting People's Lives
"We strive to help improve outcomes and create a healthier, more sustainable world for people everywhere.
LEARN MORE
Harness the power to transform clinical development
Reimagine clinical development by intelligently connecting data, technology, and analytics to optimize your trials. The result? Faster decision making and reduced risk so you can deliver life-changing therapies faster.
Research & Development OverviewResearch & Development Quick Links
Real World Evidence. Real Confidence. Real Results.
Generate and disseminate evidence that answers crucial clinical, regulatory and commercial questions, enabling you to drive smarter decisions and meet your stakeholder needs with confidence.
REAL WORLD EVIDENCE OVERVIEWReal World Evidence Quick Links

See markets more clearly. Opportunities more often.
Elevate commercial models with precision and speed using AI-driven analytics and technology that illuminate hidden insights in data.
COMMERCIALIZATION OVERVIEWCommercialization Quick Links
Service driven. Tech-enabled. Integrated compliance.
Orchestrate your success across the complete compliance lifecycle with best-in-class services and solutions for safety, regulatory, quality and medical information.
COMPLIANCE OVERVIEWSafety & Regulatory Compliance Quick Links

Intelligence that transforms life sciences end-to-end.
When your destination is a healthier world, making intelligent connections between data, technology, and services is your roadmap.
TECHNOLOGIES OVERVIEWTechnology Quick Links
CLINICAL PRODUCTS
COMMERCIAL PRODUCTS
COMPLIANCE, SAFETY, REG PRODUCTS

BLOGS, WHITE PAPERS & CASE STUDIES
Explore our library of insights, thought leadership, and the latest topics & trends in healthcare.
DISCOVER INSIGHTSTHE IQVIA INSTITUTE
An in-depth exploration of the global healthcare ecosystem with timely research, insightful analysis, and scientific expertise.
SEE LATEST REPORTS


FEATURED INNOVATIONS
-
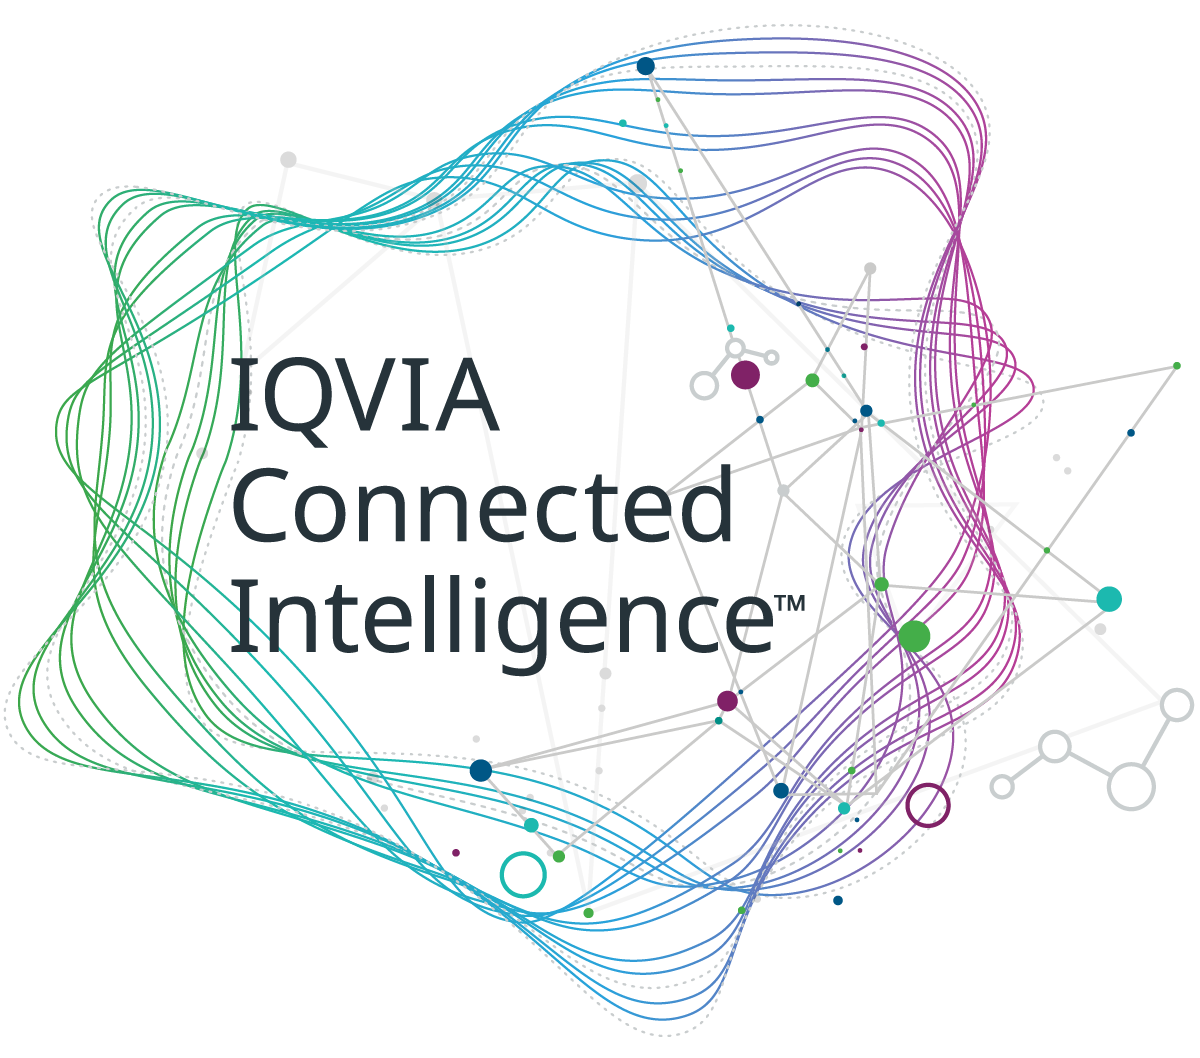
IQVIA Connected Intelligence™
-
IQVIA Healthcare-grade AI™
-
IQVIA AI Assistant
-
Human Data Science Cloud
-
IQVIA Innovation Hub
-
Decentralized Trials
-
Patient Experience Solutions with Apple devices
WHO WE ARE
- Our Story
- Our Impact
- Commitment to Global Health
- Code of Conduct
- Sustainability
- Privacy
- Executive Team
NEWS & RESOURCES

Unlock your potential to drive healthcare forward
By making intelligent connections between your needs, our capabilities, and the healthcare ecosystem, we can help you be more agile, accelerate results, and improve patient outcomes.
LEARN MORE
IQVIA AI is Healthcare-grade AI
Building on a rich history of developing AI for healthcare, IQVIA AI connects the right data, technology, and expertise to address the unique needs of healthcare. It's what we call Healthcare-grade AI.
LEARN MORE
Meet the IQVIA AI Assistant
Your new expert analyst is here. Be at the forefront of data-driven decision-making with a new generative AI tool that enables you to interact with our products and solutions like never before. Get results you can trust, faster.
LEARN MORE
Your healthcare data deserves more than just a cloud.
The IQVIA Human Data Science Cloud is our unique capability designed to enable healthcare-grade analytics, tools, and data management solutions to deliver fit-for-purpose global data at scale.
LEARN MORE
Innovations make an impact when bold ideas meet powerful partnerships
The IQVIA Innovation Hub connects start-ups with the extensive IQVIA network of assets, resources, clients, and partners. Together, we can help lead the future of healthcare with the extensive IQVIA network of assets, resources, clients, and partners.
LEARN MORE
Proven, faster DCT solutions
IQVIA Decentralized Trials deliver purpose-built clinical services and technologies that engage the right patients wherever they are. Our hybrid and fully virtual solutions have been used more than any others.
LEARN MORE
IQVIA Patient Experience Solutions with Apple devices
Empowering patients to personalize their healthcare and connecting them to caregivers has the potential to change the care delivery paradigm.
LEARN MOREIQVIA Careers
Featured Careers
Stay Connected

WE'RE HIRING
"At IQVIA your potential has no limits. We thrive on bold ideas and fearless innovation. Join us in reimagining what’s possible.
VIEW ROLESBlog
The Emperor of All Forecasts: Oncology
In this highly complex and rapidly changing environment, forecasters need better models to mitigate risk and maximize ROI, especially in high-risk, high-reward areas like oncology.
Aug 13, 2020
Oncology is one of the most complicated pharma categories to forecast. It’s also one of the most important: oncology assets are an increasingly critical part of company portfolios.
According to the 2019 Global Oncology Trends Report by the IQVIA Institute, a record 15 new oncology therapeutics were launched in 2018 across 17 indications. Spending on treatment for cancer patients reached nearly $150 billion in 2018, marking the fifth consecutive year of double-digit growth and driven entirely by therapeutic drugs. Meanwhile, companies continue to push for further oncology development. The number of oncology clinical trials initiated in 2018 increased 27% over the prior year to 1,170, and is up 68% over the past five years. With the tremendous growth in this area and the strong commercial and clinical potential, it’s no wonder that forecasters are keen to develop detailed and accurate forecasts.
However, getting detailed in this space isn’t always easy. The populations for these treatments are often very specific: many drugs are approved for a certain tumor type, specific line of therapy, and/or only in populations with certain biomarkers. To build an accurate oncology model, forecasters must be increasingly patient-focused to deal with challenges including accurate patient identification, likelihood of treatment switching and discontinuation, and time on therapy for different patients as well as pricing changes over time. They must also constantly monitor the rapidly evolving marketplace, where the large number of pipeline drugs means that standards of care and the competitive landscape can change dramatically in the time it takes to bring a drug to market.
These obstacles are forcing pharma companies to rethink their approach to forecasting in oncology. When projections are misaligned, pharma companies can fail to meet revenue goals, disappointing investors and Wall Street. But when forecasters get it right, manufacturers can optimize resources to fit the opportunity, and produce plans that deliver innovative medicines to patients who need them.
Oncology is moving away from the old approaches and is embracing a new set of forecasting tools built specifically for its complexity. Here are the top five focus areas we’ve seen lead to best-in-class oncology forecasts.
Building a More Accurate Oncology Forecast

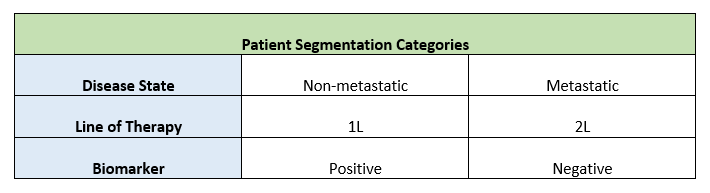
Patient segmentation – As oncology treatments become increasingly targeted to certain patient populations, best-in-class oncology forecasts require forecasters to split the population into smaller and more specific segments. For example: for a second line therapy in metastatic lung cancer with improved efficacy for a certain biomarker, a forecaster may need to model eight or more segments in order to understand their potential patient population. And while smaller segments are often more accurate, each new ‘category’ of segmentation multiplies the forecasting effort.
Other potential segments: treating physician type, region, eligibility criteria
New forecasting tools enable forecasters to better handle this this level of detail, such as by allowing sharing of data across segments or flow of patients from one segment to another. Many oncology forecasts now have dozens or even up to 100 segments with six or more segmentation ‘categories’ (line of therapy, biomarker, etc.) to accurately represent the product, making some automation a big time-saver.
The ‘flow’ of patients – As treatment paradigms become more complex, forecasters need to be able to model patients from diagnosis through various treatments and on through outcomes. Forecast inputs require assessments of how patients move between lines of therapy and understanding of how the disease itself progresses. Rather than shy away from this complexity, good oncology forecasts should be designed to consider:
- Disease incidence at various stages (not just overall disease incidence)
- Advancement of each patient segment through the treatment paradigm, with different eligibility, dosing regimens, rates of progression, remission and discontinuation, etc.
- Leakage points, or points in the patient journey where patients are likely to drop off therapy so that potential mitigation strategies can be developed
These insights are generally found through a combination of secondary research, market research, and industry data sources. Today forecasters can even incorporate real-world data directly into the forecast; a significant development in the past decade, allowing forecasters unprecedented insight and specificity around patient flow.
Understanding potential treatment regimens – The number of combination options on the market has exploded in recent years, creating an increasingly crowded treatment landscape. When forecasters are modeling their product, for each patient segment they should consider the various treatment options, expected use of their product as a monotherapy vs. combination therapy, as well as standard and adjusted dosing regimens for different types of patients.
When combined with the persistence curve and prevalence information from the patient flow model, this type of analysis allows forecasters to model highly specific groups within the population and consider the full picture of how their own product will fit into the treatment flow.
The impact of competition – With so many new products, indications, biomarkers and combinations seeking approval, it is important for forecasters to carefully consider the competitive landscape for their products.
Rather than trying to create just one ‘most likely’ truth, forecasters should build different scenarios that consider market alternatives such as: whether a competitor is approved, the level of differentiation, and at what point in time. By comparing these scenarios, forecasters can identify which scenarios to focus on to drive improved product performance or mitigate risks.
One way to do this is to use analogue products, or products which have experienced a similar competitive event. For example, to understand how your product could fare when a new immuno-oncology (IO) therapy enters your space, you might look for other products which have faced IO entry and assess what the impact was on share. The analogue provides a qualitative and quantitative benchmark to develop or compare your own product assumptions.
Address uncertainty head-on – Given the rapid changes common in oncology, and even more so in environments like today’s post-COVID-19 world, forecasters should provide a ‘window’ for management teams to see the impact of uncertainty. Analyses like Monte Carlo, tornado charts, and the creation of multiple scenario alternatives are important parts of the total picture for an asset. Uncertainty analysis allows a better understanding of which key ‘levers’ in the forecast will have the most impact on revenue. Those critical few levers can then be prioritized, with more time and resources focused towards better data collection or strategic action in those areas.
However, this uncertainty analysis must also be presented in a straightforward way. To do this, forecasters should link the analysis to the questions that management already has on their minds – there are usually many to choose from! What if competitor X gets more share than expected? What if we launch two months earlier? Or two months later? Should we focus on better penetration in Brazil or France?
For those key questions, use simple, visual reports or reporting tools – or even real-time dashboards where managers can conduct their own simple what-if analyses – so that everyone has easy access to these types of insights.
Oncology Forecasting on the Horizon
At IQVIA we are passionate about helping clients across these 5 focus areas.
For example, we recently worked with a client on a comprehensive oncology-asset forecast for an evolving market landscape. The client wanted a detailed understanding of current and future market dynamics so that they could best predict product performance vs. the competition and assess when and how patients would become eligible for their product.
Using IQVIA’s Forecast Horizon tool along with real-world data, our team tested a set of assumptions regarding dosing, duration of therapy and compliance to create a series of patient segmentation models. The client integrated those models with primary research to define unique values for dosing and duration by line of therapy. The final model is used with high frequency – sometimes even daily – by multiple teams across both US and European markets, informing more accurate models that can react quickly to changing market dynamics.
While we can’t take the complexity out of oncology forecasting, we can help to address each of these five focus areas to bring better accuracy and more insight to oncology forecasts.
For more information on IQVIA’s forecasting offerings, click here. Or to learn more about the Forecast Horizon platform, contact us at ForecastHorizon@iqvia.com.